macenize.pro
Mac Vitals 1.0 · macOS 14+ · Apple silicon & Intel

The system monitor that also watches your local models.

Activity Monitor tells you a process is busy. Mac Vitals tells you your machine throttled for fourteen minutes and that is why qwen3 is generating 18% slower than it did yesterday. System vitals and LLM telemetry on one timeline.

1.36%idle CPU, one core
26MBmemory footprint
74msdropdown open
0bytes sent anywhere
01 · At a glance

Everything, one click from the menu bar

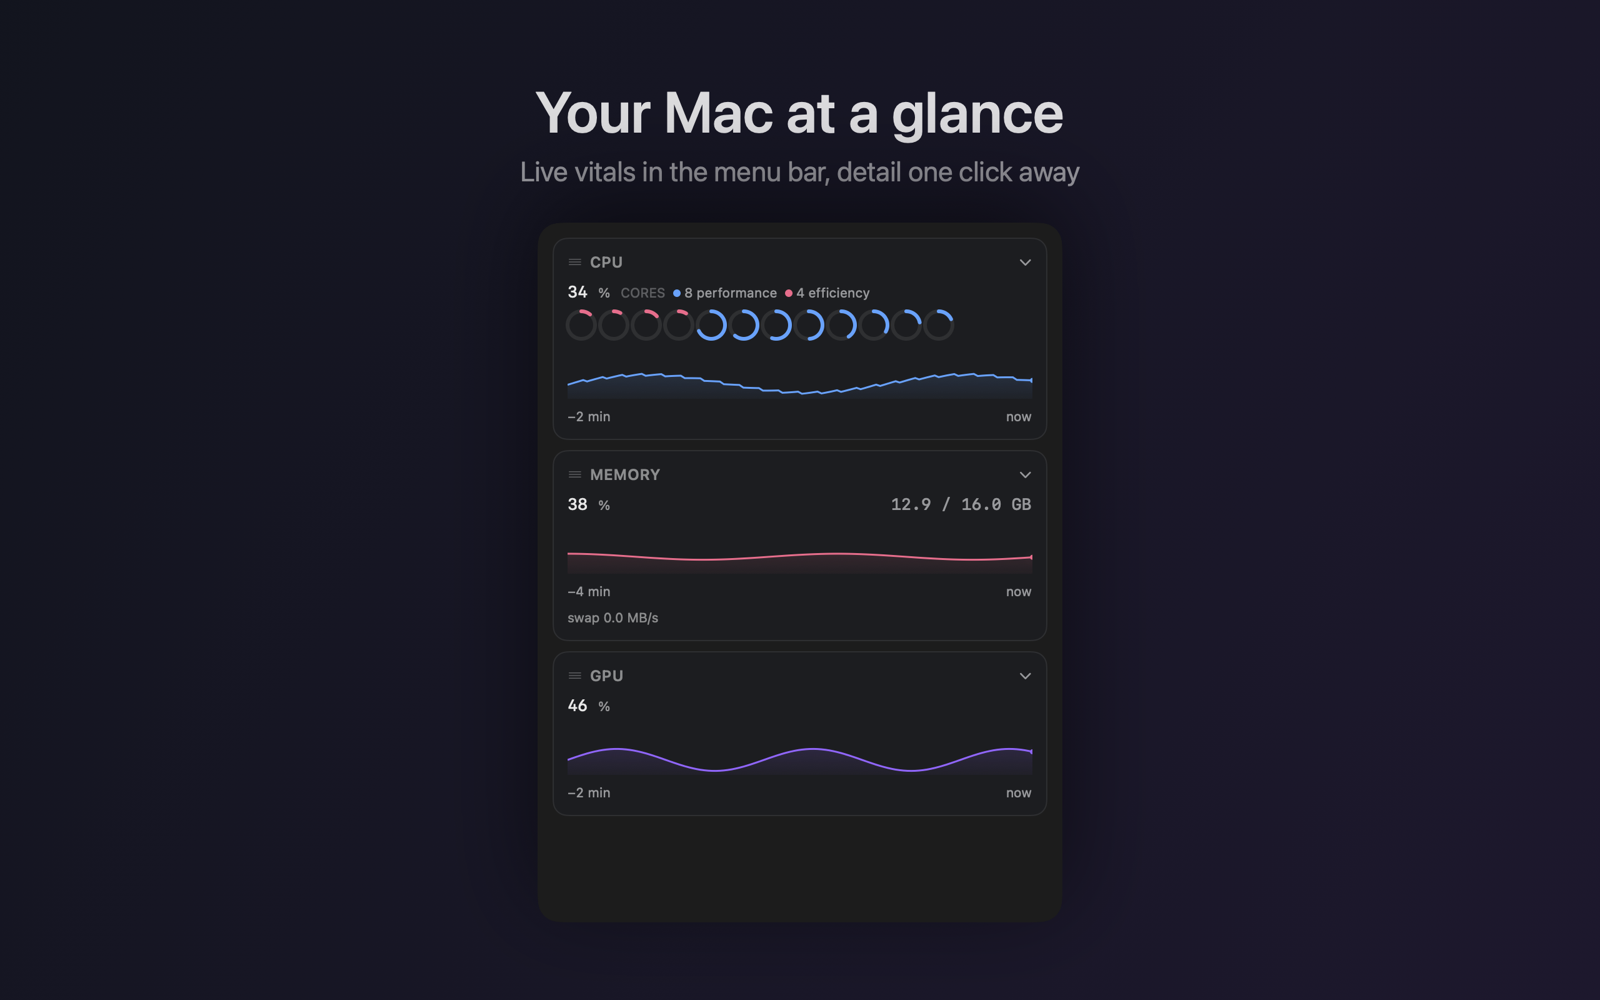
Widgets in whichever style suits the metric — sparkline, gauge, value, icon or stacked pair. Click one and you get that module, not an undifferentiated list of eleven cards.

Mac Vitals dropdown showing CPU, memory and GPU cards with per-core rings and sparklines
FIG. 01 Per-core rings distinguish performance from efficiency cores, read from the kernel rather than guessed at.
02 · Correlation

Why it slowed down, not just that it did

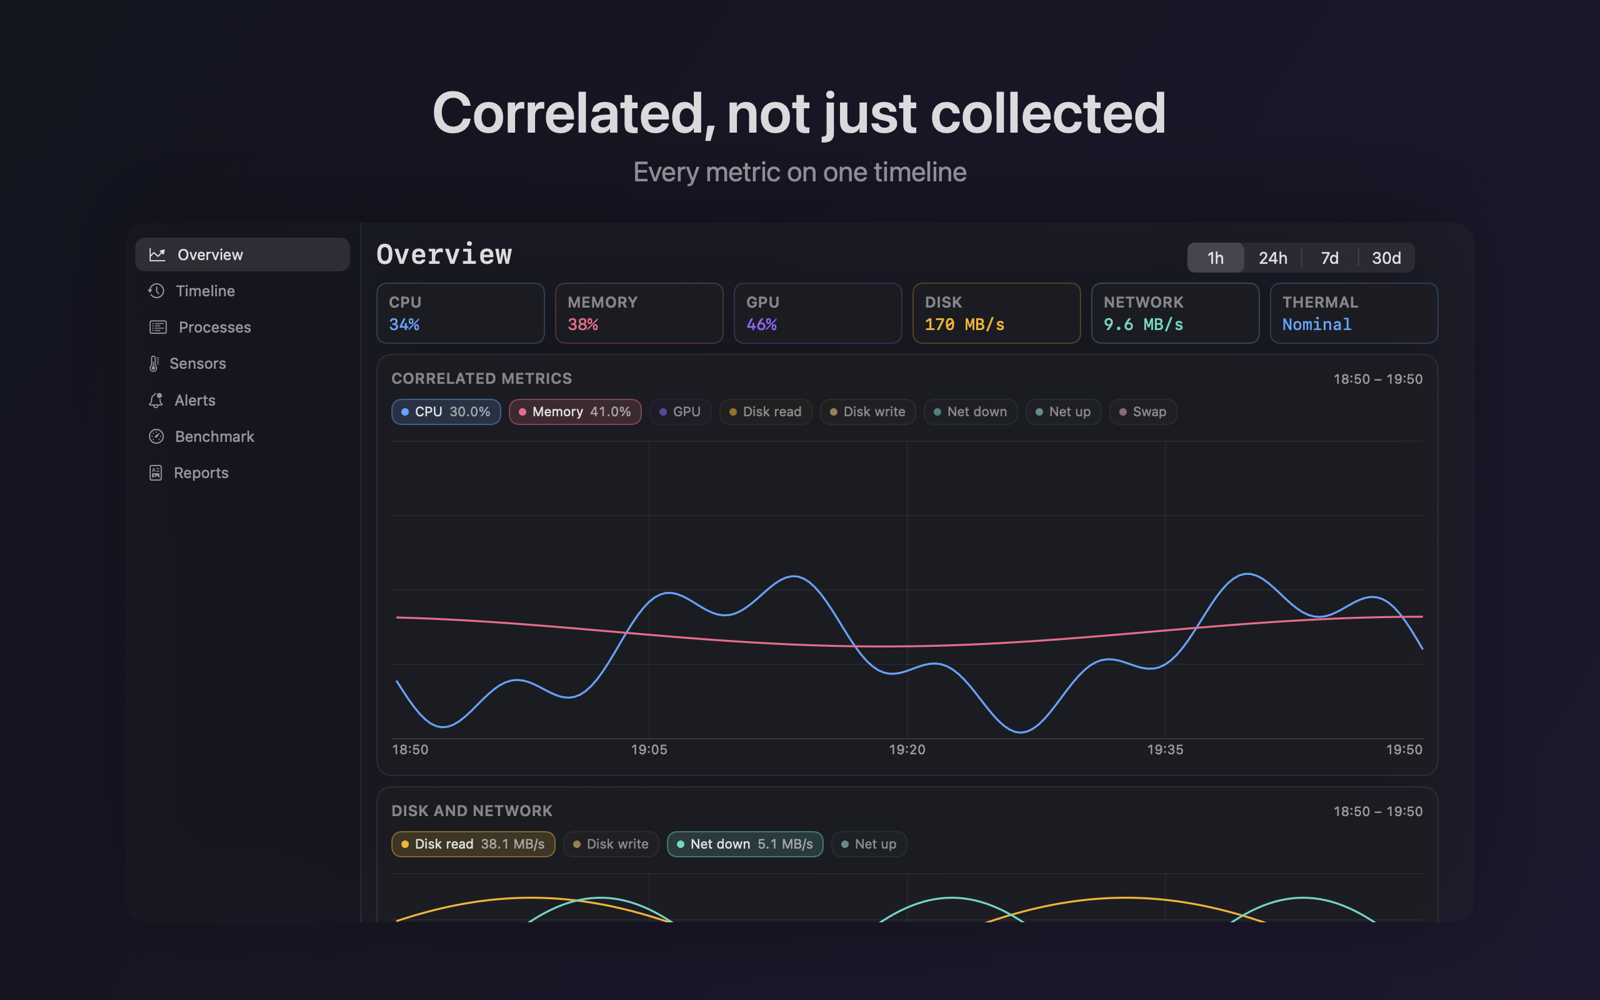
Every metric on one time axis with a synced crosshair. Hover a spike in CPU and see what memory, disk and the GPU were doing at that exact instant.

Deep dashboard with correlated CPU and memory traces over one hour
FIG. 02 One hour of history, four ranges out to thirty days, with event markers for model loads, builds and thermal throttling.
03 · Alerts

Alerts with somewhere to go

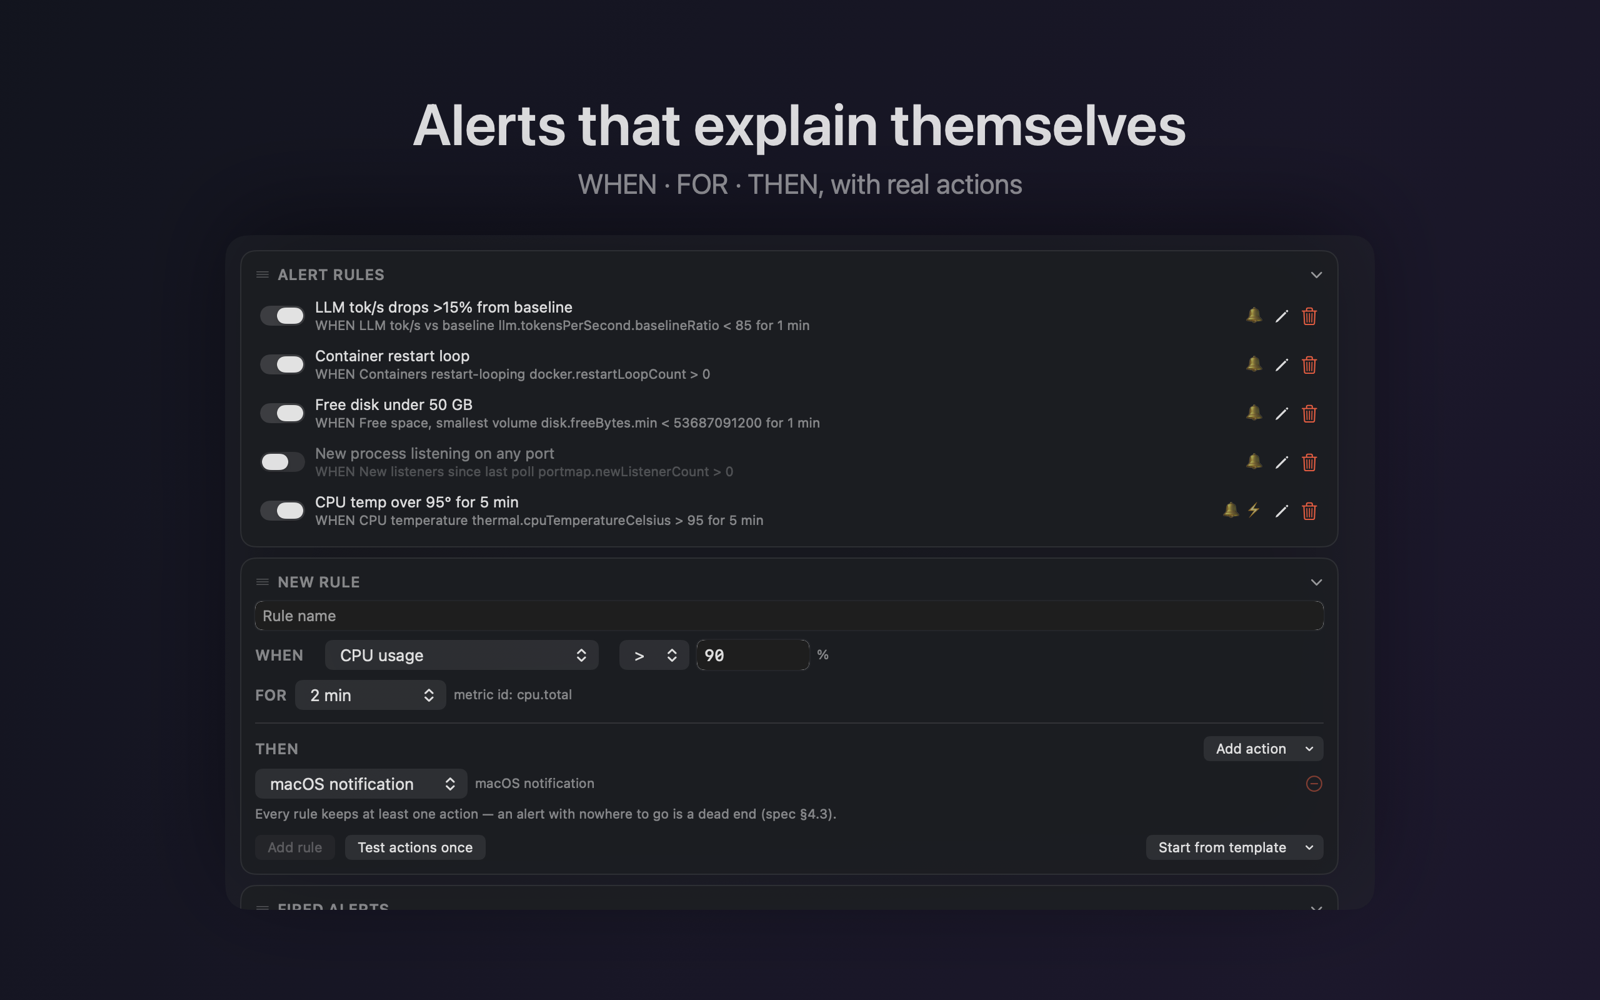
Rules read as WHEN · FOR · THEN and fire a notification, a shell command or a webhook. Anomaly cards compare against a baseline bucketed by hour of day, so 90% CPU at 3am is not treated like 90% CPU during a build.

Alert rule builder with shipped templates and a fired-alert history
FIG. 03 Five templates ship with the app, including LLM tok/s regression and container restart loops.
04 · The differentiator

It watches your models too

Every other monitor stops at the hardware. If you run models locally, the interesting question is not "is the GPU busy" but "why is this generating slower than it did an hour ago" — and answering that needs inference telemetry and machine telemetry on the same axis.

Detection
Ollama on :11434 and LM Studio on :1234, found automatically. A server running with nothing loaded is reported honestly as no model, not as an error.
Live throughput
Tokens per second and time to first token, taken from the server's own timing fields rather than estimated, with prefill and generation shown separately.
Context and memory
Context window fill, KV cache size, and how much unified memory the resident model is holding.
Pre-load guard
Before a model loads, its size is compared against free memory. "Loading llama3.3:70b will exceed free memory by 9 GB → swap → expect roughly 3× slowdown" is more useful than watching it happen.
Regression detection
Today's tok/s against this model's own 7-day baseline, correlated with thermals — which is how you learn that an 18% slowdown was throttling rather than the model.
Controls
Unload a model, set keep-alive, or copy the ollama run command, without leaving the menu bar.
05 · Comparison

Against what you already have

Activity Monitor ships with your Mac and is genuinely good at listing processes. Stats is free, open source and well made. Here is where each one stops, measured on the same M2 Pro on the same afternoon.

 Activity MonitorStats 3.0.11Mac Vitals
Lives in the menu barpartialyesyes
History and timelinenominutes30 days
Correlates metrics on one axisnonoyes
Local LLM telemetrynonotok/s, TTFT, context
Container statsnonoyes
Listening ports with repo contextnonoyes
Anomaly detection with baselinesnonohour-of-day
Alert rules with webhooksnonoyes
Idle CPU, one core1.82%1.36%
Memory footprint143 MB26 MB
Helper processes51
Method

Both apps were launched on the same machine and measured over 90-second windows using CPU-time deltas, with memory read as phys_footprint. Activity Monitor is left blank on cost because it is not a comparable resident menu bar app.

One caveat we will state rather than bury: Stats was displaying more menu bar modules than Mac Vitals during the measurement, so part of its cost is doing more work. A module-for-module test would be stricter.

06 · Requirements

What it needs

macOS
14 Sonoma or later. Built for macOS 15 and 26.
Hardware
Apple silicon and Intel. Per-core rings, sensors and the Neural Engine gauge show whatever your Mac actually exposes.
Disk
About 12 MB for the app; the metric history stays under roughly 80 MB at 30-day retention.
Optional
Ollama or LM Studio for the LLM module. Docker, OrbStack or Colima for containers. Neither is required and neither is bundled.
Signing
Developer ID, notarized by Apple and stapled, so it validates offline.
07 · Questions

Reasonable objections

Will a monitor slow down the thing it is monitoring?

That is the contradiction we designed around. Idle cost is about 1.3% of a single core — on a 12-core machine, roughly 0.1% of total capacity — and 0.33% if none of your widgets is a live chart. Samplers pause when nothing is displaying them, and the menu bar only redraws when the pixels would actually differ.

Why is there a free tier and a paid tier?

The six system modules, 24 hours of history and two menu bar slots are free forever. Pro is a one-time $29 for the developer tier: LLM monitor, containers, dev processes, port map, remote agents, the alerts engine, 30-day history, reports and fan control. No subscription, no account, and the licence is verified offline.

Is my data going anywhere?

No. There are no accounts, no analytics and no crash reporting. In its default configuration the app opens no outbound connections at all, and you can verify that with its own connection table or lsof -i. The only traffic is what you configure: a webhook you wrote, or servers you listed yourself.

Why is the App Store version missing features?

The Mac App Store requires the App Sandbox, which blocks reading other processes, running lsof, opening the Docker socket and talking to AppleSMC. We measured each one rather than assuming. Mac Vitals Lite keeps everything the sandbox permits — including the LLM monitor — and the direct edition keeps the rest.

Electron?

No. Swift and SwiftUI with AppKit where AppKit is better, which is why it is 26 MB rather than 300.

What happens when a sensor is unavailable?

You get an em-dash and an explanation, never a fabricated number and never a frozen stale one. A reading older than five seconds dims to show it is stale.

Can I try Pro first?

The free tier is not a trial — it does not expire. If Pro turns out not to be for you, email us within 30 days and we will refund it.
08 · Editions

Two builds, one honest reason

The Mac App Store requires the App Sandbox, and the sandbox blocks per-process inspection, listening-port lookup, container sockets and hardware sensors. Rather than pretend otherwise, there are two editions and this table tells you exactly what the sandbox costs.

Mac Vitals

Direct download · notarized · free core, Pro $29 one-time

  • System vitals, GPU, disk, network, battery
  • LLM monitor — Ollama & LM Studio
  • Dev processes and process X-ray
  • Port map with one-click kill
  • Docker / OrbStack / Colima stats
  • Temperatures, fans and wattage
  • Remote agents over SSH
Download the DMG

Mac Vitals Lite

Mac App Store · sandboxed · free

  • System vitals, GPU, disk, network, battery
  • LLM monitor — Ollama & LM Studio
  • Insights, alerts, timeline, dashboard
  • Dev processes and process X-ray
  • Port map
  • Container stats
  • Temperatures, fans, remote agents
Get it on the App Store
09 · Measurements

The numbers, and how we got them

Measured on an M2 Pro with CPU-time deltas over 60-second windows — not ps %cpu, which is a decaying average — and phys_footprint rather than resident size, which counts shared framework pages.

MeasurementResultBudget
Idle CPU, three widgets, live chart1.36%< 1.8%pass
Idle CPU, no live chart0.33%< 0.5%pass
Dropdown open2.4%< 3%pass
Memory, idle26 MB< 60 MBpass
Dropdown open latency74 ms< 100 mspass
Outbound connections, default config00pass

For comparison, measured in the same session on the same machine with the same method: a well-regarded free monitor used 1.82% of a core and 143 MB. We are not claiming it is a bad program — it does more work per tick. We are claiming we measured both rather than guessing.